Visualizing Data and Situations
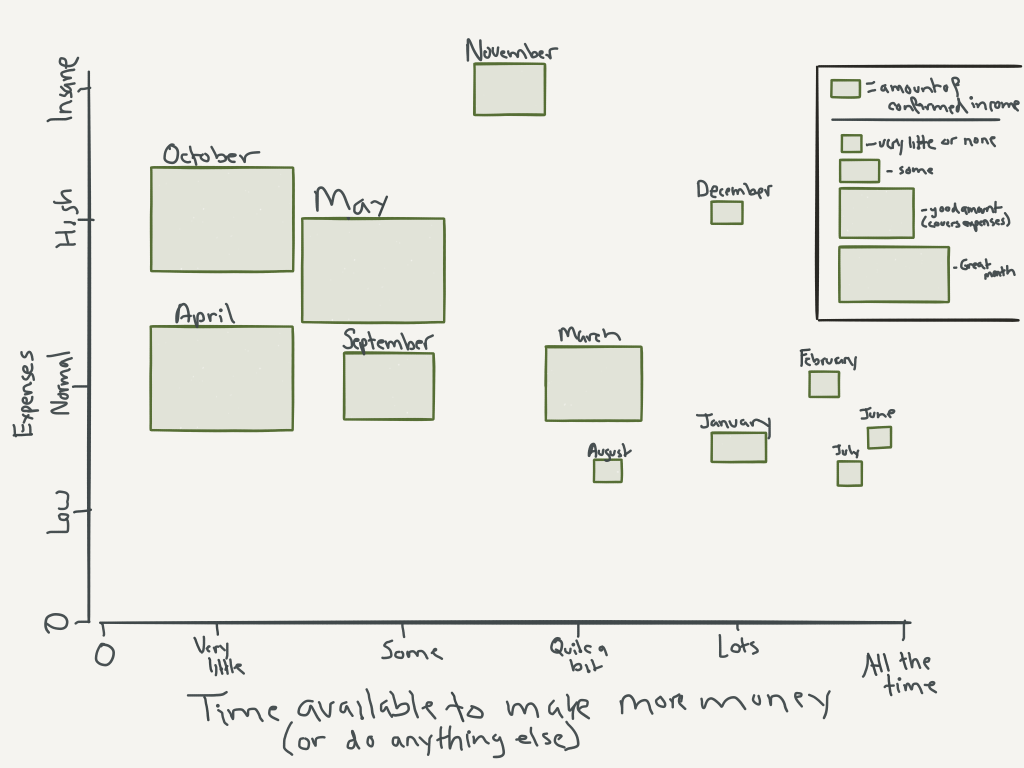
September 28th, 2016 by PotatoRecently I got an email from Chris (his mailing list is actually good, BTW). He includes these neat sketches to try to understand his money and see things in a new light. A few weeks ago was one on his money infrastructure, which I’m hoping he’ll turn into a post for non-subscribers to see, but the one I want to touch on this week is a sketch of his irregular income through the year that he just sent out. It’s basically a bubble chart (though he uses squares instead of bubbles), showing how his confirmed income varies through the year.
I saw that and thought neat, this is presenting some information in a way that will make people think.
I then thought “this can be presented differently, especially if I would want to use this information to plan my freelancing activities.”
In that figure, he has as his independent axis (x-axis) “time available to make money”, with the months scattered all around, and expenses running up the left side. But you can immediately see a strong relationship between the size of the boxes (committed income) and time available to make money — when he has less committed income, he has more time to make money, which is not very surprising and perhaps not what you want to take away from the chart.
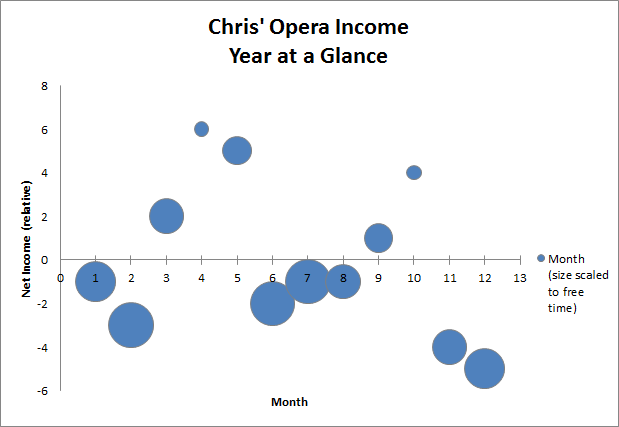
Instead of scrambling the months, we can rearrange it chronologically.
He also has expenses and income as separate variables for each month. Sometimes it’s useful to think about those as separate things, especially when you can attack them from either side. But if you’ve more-or-less figured out your expense side and want to focus on making more money (as the initial x-axis implies), we can instead plot the difference between expenses and income — when are the shortfalls? How do the shortfalls line up with opportunities to make more money? Are there blocks or are they one-off months in islands of pre-committed business?
So now with net income, time available, and time through the year plotted I could use this layout to start planning my side business activities.
As Chris, I could see that from November through February I have a large shortfall in budget, and a decent amount of free time, so this period I’d try to book up with freelance work, with some possibly spilling into March to wind-up (and I’d have to be done for the big Opera period in April). Then in May some time opens up, but the motivation to get stuff going won’t be high as there will still be positive net income. However, there will be minor shortfalls all through the summer with lots of time to spare, so assuming that Chris needs to account for lead time to book clients, he would use the time in May to do that business development, and then work freelance lots through the summer. Then come October, Chris really will have no time to spare, so booking business for the Nov – Feb period will likely have to wait until November (and even then the time is not as open). That means he’ll need to budget to deal with that big shortfall expected in Nov, as it’ll take some time for the freelance income to pick up then.
So here I’ve abstracted away a variable — I’m assuming that I’ve already dealt with planning my [Chris’] expenses, and am trying to visualize the data in a way to help me manage a freelance career on top of a singing career. And this may be a more useful visualization for that particular problem.
But that doesn’t make this a better general approach. After all, some of Chris’ expenses may be variable and flexible, and he would want to plan out when to schedule those based on when there will be money in his accounts after paying gigs, and when he will have time. In that case he’ll want to see income and expenses separately — indeed he may want to collapse income and time available to focus on time through the year and then have different bubbles overlaid for different kinds of expenses. Then he could plop some expenses in different places to see what would fit best for him. For example, he may want to schedule his dental appointments in November and May, when he has time and money after his busy October and April gigs. And indeed, he had just such a visualization sketched out when I chatted with him about this.
With some things in life, especially personal finance, there are many more ways to look at data and to try to present it in ways that help guide different decisions. I’m trying to make use of this more in the course — there’s lots of line and scatter graphs, but also a few simple sketches and pictograms with bunnies. But there’s lots more room to go, and I’m excited to see other people sketching things out in different ways
Anyway, stay tuned to ragstoreasonable as I’m sure Chris is going to come out with some neat visualizations and sketches soon (peerpressurepeerpressurepeerpressure).


 Questrade: use QPass 356624159378948
 Passiv is a tool that can connect to your Questrade account and make it easier to track and rebalance your portfolio, including the ability to make one-click trades.