Robo-Advisor Comparison Calculator
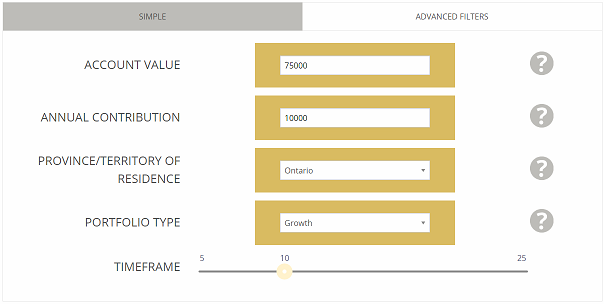
November 23rd, 2016 by PotatoI’m very happy to finally be able to announce something I’ve been working on for months: a new Robo-Advisor Comparison Calculator at autoinvest.ca!!
I think the robo-advisor model looks like a great choice for a lot of Canadians. Many will save even more money with a do-it-yourself approach (and I have a book and course to help show them how to do that). But for those who don’t have the interest in DIY (or who will DIY all the parts that involve decisions, and use as service for the purchasing and rebalancing parts), having a low-cost option to handle your investments is wonderful.
Why a Calculator is Needed
Of course, there are a lot of robo-advisors out there these days, and trying to find the one that’s best for you can be a challenge. There certainly isn’t a clear winner across the board, and even comparing them at a glance with a table is quite the challenge. For starters, there are several pricing models in play. I love the flat-fee model that firms like NestWealth use, but for many people with smaller accounts paying a percentage of assets is still the cheaper way to go. However, even there each firm has their own rate and their own thresholds for where their percentages change — and some are marginal (like 0.5% on the first $X no matter how much you have) and some are thresholds (X% on the whole amount as soon as you cross a threshold).
On top of that, each firm has a different set of investments that they will put you in to, with their own underlying costs. Even finding what these costs are can be a challenge sometimes, and they’re going to be different depending on your risk profile. Sometimes even by how much you have to invest, as you may get access to cheaper underlying ETFs when your account gets larger (or conversely, there may be more slicing-and-dicing for larger accounts).
So Sandi Martin made a nifty tool a while ago to help with this comparison. It was popular, but that popularity led to some issues: people were colliding when too many tried to use it at once, and every now and then people would use cut & paste (instead of copy & paste) which broke the cell references. It was time for something better.
A Better Calculator
She had the idea of building a better, dedicated calculator on its own website, and I jumped on board to partner with her on making it happen. While we were at it we added some nifty new features, including the ability to filter the results according to whether they offered certain services, account types (like the RESP, or RESP with BC/Sask provincial grants), or investing styles.
A part I really like is how she broke down planning services – lots of them have planning or concierge or other advisory services, where you can speak with a person in some capacity about your particular situation. But whether the advice is limited to your portfolio, or savings, or your more general financial situation can vary. So Sandi has broken the advice up into several categories with representative questions.
It’s fast, doesn’t have the issues of the spreadsheet, and looks cool. I’m super proud of this.
Things to Remember as You Use It
This will help you compare the costs of different robo-advisor services for your situation. However, the cheapest one may not necessarily be the best one for you. Having the pricing information helps you better compare the other features, so you can see if you’re willing to pay $X more to get certain kinds of advice, portfolio options, or whatever feature it is that interests you.
We haven’t put in a DIY with ETFs option to compare to the robo-advisors. There are some good reasons for that: because it would always be cheaper, because I have DIY stuff to sell and we don’t want the perception of a conflict-of-interest, and because we don’t want people who may be looking for a robo-advisor because they’re uncomfortable with DIY to feel pressured to go down that road. But if you’re DIY inclined, then approx. 0.14% + some trading commissions (depending on your broker, but ~$10-100/yr is not far outside the ballpark, depending on how you arrange your investing) would be a decent comparison figure.
People Who May Like This
The obvious target audience is people who want to go with a robo-advisor and need a starting point for their comparison, and those who are stuck choosing between a few competitors and want a way to calculate the cost difference involved.
I think that other groups who may be interested in this include mortgage brokers and fee-only planners. The latter is fairly obvious: they can provide the planning but not the asset management services, so they can pull up the calculator and point their clients to a robo-advisor that suits their situation if needed, with no concern about a direct referral creating the perception of a conflict-of-interest.
For mortgage brokers, the notion of investing doesn’t come up often. However, a big challenge is helping their clients move away from the gravitational well of the big banks. If they can help their clients find a better home for their investments, that makes them less resistant to going with a non-bank lender for their mortgage, while potentially also saving the clients a bunch on their MERs.
Behind-the-Scenes
How did you make it?
The data-gathering was perhaps the hardest part, as a lot of the information that goes into the calculator is not readily available. Sandi had to hustle to get all the information out of all the firms, and then verify its accuracy.
The tool itself is not a spreadsheet any more, it’s a custom bit of programming using PHP, SQL and some Google APIs. We did have to outsource some of the programming, which cost actual money.
Any amusing stories to share?
Actually, not really, though there is a bit of minor frustration involved.
Part of my job was to help come up with the math and logic for the developer to then implement. So I had a fairly general structure that would accommodate several fee tiers and pricing models: flat fees, marginal fees, threshold percentages, and even mixed models (as one firm did until recently). We could also account for different fees on the underlying portfolio, which can change based on the amount invested. We got it all set up at the same time that data collection was going on, and had to decide on how many tiers to build in. “Four or five should do it, who would possibly have more than that†I said.
Well, you’ll see a slightly awkward work-around with one firm that did have more tiers in their pricing structure than we built the back-end database to handle (and I’ll note the end result is still correct).
How do I get my ad on this?
Please contact Sandi at sandi[at]autoinvest.ca.


 Questrade: use QPass 356624159378948
 Passiv is a tool that can connect to your Questrade account and make it easier to track and rebalance your portfolio, including the ability to make one-click trades.