Things Are Getting Very Real

March 14th, 2012 by Potato

We’re clearly doing this all wrong. While we’re getting prepared and things are starting to feel very real now with all the baby stuff, we’re not spending nearly enough time enjoying our last kid-free days. I think that delightful mixture of anticipation and terror is giving way to thoughts of “what have we done” and brief panic attacks. But we’ve done our first aid and baby care and birthing classes; the furniture is assembled and the adorable baby clothes ready to be puked and pooped on. I don’t know if anyone is ever fully ready for this, but we’re as close as we’re going to get.

And most importantly, the nest is feathered:

The crib is assembled and the wall decals up.

[And no, the stuff in the crib won’t still be in there when it’s time for baby to go in, we’ve been warned about suffocation hazards. But for now it’s adorable.]

Tater’s Takes – Charlie Munger

March 8th, 2012 by Potato

I still can’t believe how busy I am in unemployment. I figured if nothing else, having no steady income would be a chance to take some time to catch up on all the video games I didn’t play over the xmas break. Instead, I think I’ve been almost as busy as when I was working. The move didn’t help with that, so once I finish the last bit of unpacking (this week?) that might give me a bit of time back (and none too soon — Mass Effect 3 just came out!).

What I’ve found really shocking though is the complete silence on the job front. Not a single interview, even for the jobs I was perfect for. Ah, well, hopefully something will come up soon… On with the links!

An old speech of Charlie Munger’s is reposted, and it’s still good reading.

Rick Mercer epitomizes the condo insanity with the Condo Gun.

More and more housing bubble stories in the media, including the cover at Maclean’s. VREAA says this:

“Show of hands.. Anybody who hasn’t heard that Housing in Canada is in a ‘Bubble’?
Nobody?
Okay… so we’ve all heard.
Pumps are primed.
Now class… How are we going to respond to initial price drops?
Anybody?”

Larry MacDonald puts up another blog post attempting to counter the housing bear sentiment. I will admit: I simply do not understand his position. He doesn’t seem to refute the severe overvaluation — indeed, he confirms it — yet for some reason it doesn’t seem to bother him. Instead he talks about the lack of catalysts: “I agree with him that there is over-valuation—but I also believe there are other factors to consider. […]the catalyst for an end to the U.S. housing mania—a major tightening in monetary policy. I don’t see it in Canada yet;[…]” [emphasis mine]. To put it in terms of a bad analogy, it’d be like being at a party and finding a gas leak. “I smell gas. This is dangerous, I’m getting out of here” I’d say. “I smell it too,” Larry might say, “but nobody’s smoking in here. It’s fine. we can just open the windows and it’ll slowly air out.” “Well, either it blows up, or we’ll feel a chill with the windows open. Either way, this party is going to suck. Later!”

After saying he was leaving blogging and posting less frequently, TMW returns with this little post on valuing real estate. What I find hilarious is that just a week or two ago the BoC released a report saying that this was exactly the algorithm people used when valuing real estate, and that it was faulty because all it did was check to see if a particular property was over/under-priced relative to recent market moves, but implicitly assumed that both the starting price and the growth rate were rationally determined by an efficient market. If those two conditions weren’t true — and believe me, they’re not — then bubbles easily form because very few market participants are doing absolute pricing analysis. So this is a great method to use if you want to try to price a property for sale (to meet current market conditions), and a good one to use if you don’t care about overall valuation and just want to avoid being the one sucker who buys the most over-priced condo in the building… but you need an additional check as to the overall market sanity (i.e.: a rent vs buy analysis for your situation).

John Hempton at Bronte Capital explains why, despite Bronte’s small size, he isn’t chasing small caps. In short, he doesn’t think they’re as over-looked as many who chase small-caps think.

Boomer & Echo compare index funds to the big bank’s equity mutual funds. It goes about as well as you’d expect.

Michael James wonders if Berkshire Hathaway may be an index alternative and suitable for a passive investor. I figure why not: it’s diversified, the fees are low, and the long-term track record is good.

An article in the New York Times describes research that shows people with high IQs may get better investment returns. Though it doesn’t look like the returns come from digging up under-valued stocks, simply from following common sense investing principles that don’t require a high IQ to understand. “[Economists…] argued in a paper published in 2008 that many households avoid investing directly in stocks out of vague fears that they might be deliberately misled or cheated.” I know I’ve seen that kind of misplaced distrust many times when discussing investing. Somehow, over-valued under-diversified real estate is safe, and stocks are a rigged game.

Teller talks about magic and human perception. A fun little read! [HT: Barry Ritholtz]

The Deceptive Importance of Changes in the Homeownership Rate

March 2nd, 2012 by Potato

One meme out there regarding the housing bubble is that today’s price doesn’t matter because immigrants are going to create so much demand that they’ll support the market. “Toronto has X thousand immigrants. Every year.” To paraphrase & combine a few examples. Thing is, you can’t look at immigration in a vacuum. Ben Rabidoux must be seeing the same chatter, since he also just had a post on population growth.

Consider my shower. Let’s say I just bought the AwesomeSauceâ„¢ 8-head shower system, capable of spraying out an amazing 23 litres of skin-scorching hot water a minute. I clamber on in there, intent on scrubbing away the shame of being a renter.

How long before I flood my house?

You can’t answer because that’s just one part of the problem, on the other side is my drain, taking away the influx.

So for immigration, part of that is just offsetting the natural population decline in the country. The net national growth rate is just a touch over 1%. It’s higher in Toronto and Vancouver, but still just about 2%. For comparison, the US growth rate is about 0.8%, and was running neck-and-neck with Canada over the last decade. Ben has some charts showing how much higher it was in some states that boomed and busted.

Ok, 2% growth per year every year is a fair bit of growth: enough to over-power infrastructure and public transit and the like over time. Toronto is full and getting even more crowded. But is that demand driving housing prices, and will it continue to drive housing prices? How can we consider other metrics in the face of the unstoppable immigration tidal wave?

Another important factor to consider is the ownership rate: in 10 years we went from something like a 65% ownership rate to 70% nationally. That seems like a trivial change: half a percent a year. Let’s try to put that ownership rate change in perspective with population growth to get an idea of some of the trends driving housing:

In the GTA, with all that immigration, we went from 5 million people to 6 million in 10 years. That’s something like 650k-700k new owners created by immigration/population growth (households would be lower by some factor like 2.4X, and about 300k of the newcomers would be renters). We also created 250-300k new owners by increasing the ownership rate. And that’s if you are conservative and assume that the increase in the ownership rate in a boom town is the same as it is nationally.

To get to my point: there’s a limit to how much that ownership rate can be increased. There’s a hard limit of 100%, but even below that, there will be some portion of the population that just isn’t going to buy. Even if we don’t reverse course and bring it back down to 65% — just stay here at 70% — that has consequences. Over the last 10 years, demand has been 40% higher than it “should” have been because of the expanding ownership proportion. We had ~1M (or likely more) new owners in the GTA rather than ~700k expected from population growth alone. If the next 10 years features a reversal of that trend — owners becoming renters again, or the average age of owning pushing back a few years — then demand could swing from 1M/decade to 400k/decade, or a 60% drop. Even just stopping the process of borrowing future demand and hitting a plateau represents a 30% decline in demand from the current run rate.

What will that do to prices? To be fair to my point above about looking at both sides, you have to know what the supply situation will be like. But everything suggests supply will stay robust.

Unfortunately like many other pieces of the puzzle, there’s no timing information with this one: though the US topped out at 70% homeownership, that’s not to say that Canada can’t keep going for 75% in the next decade, or 80% in the one after that. But the seemingly small change in this number represents a very meaningful slice of demand, so it’s important to understand — doubly so because it’s a factor that has changed over time, whereas population growth and immigration have been steady for much more than just the last 10 years.

Default Rate and Seth Klarman on Junk Bonds

March 1st, 2012 by Potato

A rolling loan gathers no loss.

I’ve long said that the mortgage default rate has no predictive value in spotting housing market trouble: it’s a lagging indicator. The reason is very common-sense: as prices increase rapidly, even someone with no equity to start with can refinance after a year or two, or sell and be able to cover the transaction costs. There is no reason to default in a rising market unless you’re particularly bad at arranging your finances and can’t even make it a few months to be rescued by the rising tide.

Then I was reading something about the junk bond fiasco of the 80’s and came across another interesting feature of credit bubbles. As you lend to less and less creditworthy people/businesses, your eventual loss rate will increase — those chickens eventually come home to roost. But firstly, rolling loans gather no losses: with loose credit, and increasing valuations on the underlying collateral, it’s very easy to just borrow your way out of trouble for the short term. Even then, the defaults don’t occur immediately except in the most egregious of cases (which did happen at the end of both the junk bond craze and the US subprime debacle). Another feature is that you increase the size of the lending pool as the credit bubble inflates. So if you look at the default rate, it may be flat even though the number of defaults is steadily increasing — just not quite as fast as the denominator (total credit) is also increasing. That makes the default rate look better than it really is, and doubly so when combined with the lag time before a loan defaults. Seth Klarman says that you could have spotted the junk bond crisis before the bust by looking at the default rate and adjusting for the increase in the denominator.

To give a quick example of how that would work, say your default rate is steady at 1% — this is a level you are happy with and for decades in your industry has been a level that indicates there’s no trouble. Then you rapidly increase the size of your loan portfolio, doubling it within say 6 months. You should have zero defaults on the new loans since they haven’t had time to default, so your default rate should be halved now. If it’s still 1%, you have a problem, and may not realize it.

So I went to look up some Canadian mortgage data. As expected, the default rate is low. It was rock-bottom when the 90’s first started, as prices were at their peak there. Then as Toronto’s bubble crashed out and the economy worsened, the default rate increased, topped out at about 0.7%, and then improved. Around the economic crisis and recession in 2008/2009 (also when Alberta prices started their “soft landing”) the rate increased modestly, but is still generally fairly low. That’s the blue line, and is a chart you’ve probably seen many times before.
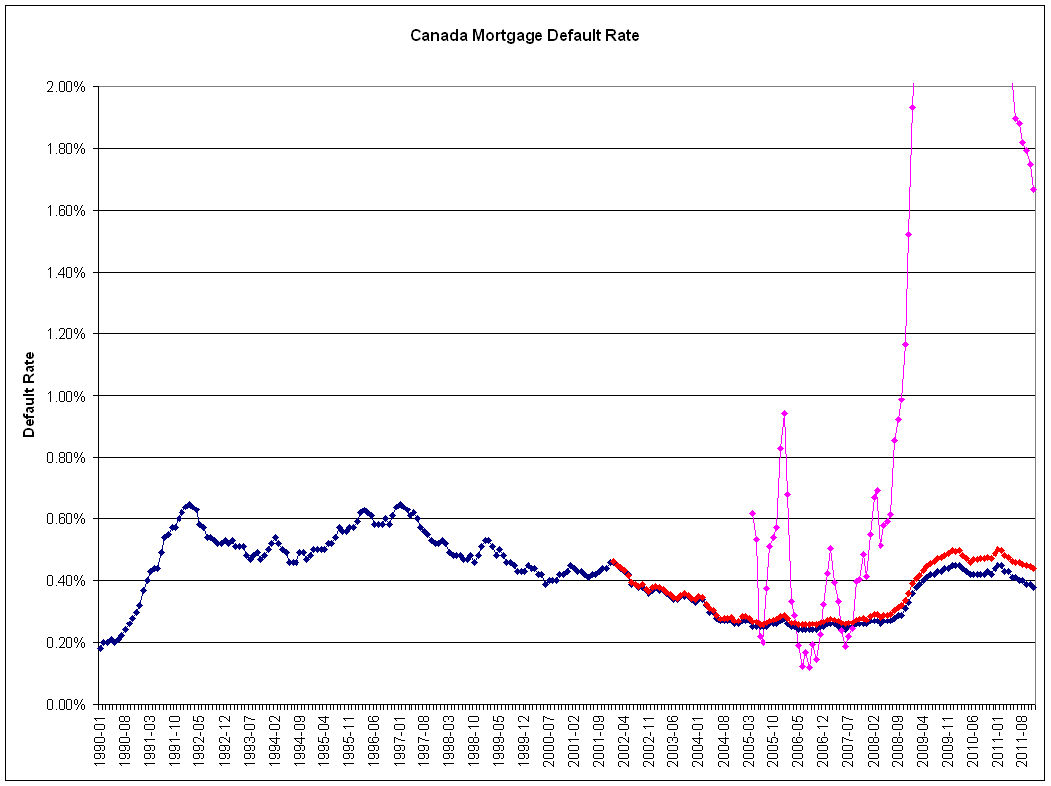
Canadian mortgage default rates, national. Blue is the traditional measure. Red is the current number of defaults to the traditional mortgage pool. Pink is the default rate on the bubble excess mortgages. Click to embiggen. For the image impaired, this ain't pretty.

But in that dataset is also the total number of mortgages, and that has increased much faster than the population growth rate: if you assume that the year 2002 is a “normal” period to start from, and increase the mortgage size with our population growth rate (1.1-1.2% according to Google), then in 2012 we should have just about 3.7M mortgages. Instead, that number is higher by about 16%. If you then take the number of defaults, and compare them to that denominator, you get an adjusted default rate in red — and that is, by the conservative historical standards of our country, fairly high. And this is still a lagging indicator. But on an absolute basis, it’s still pretty low: while the growth in the mortgage pool has been tremendous by mortgage standards, the dilution of the denominator isn’t as dramatic as it was with junk bonds.

To cut it up a different way, consider the situation as separate pools of mortgages. You’ve got say 3.7M mortgages that represents the normal, conservative Canadian lending market that everyone likes to talk about. These are the people that would own their houses no matter what the real estate boards were projecting, many have been in real estate for decades and have significant equity. With times being reasonably good and house prices being at record highs, we might expect the default rate on this pool to be near its lows of 0.1-0.2%. Let’s be generous and say it’s even higher than that — 0.25% — so this pool of mortgages represents about 9300 of our defaults today.

Then we have the 560k new mortgages that represents all the insanity of the past 12 years: demand pulled forward, low downpayments, long amortizations, teaser rates, fuzzy thinking — whatever it was that drew these people into the market that maybe shouldn’t have been there in the first place. Of that pool, 140k were issued just in the last year alone. Since we don’t expect defaults to occur immediately unless there is a huge problem in underwriting, we wouldn’t think of defaults as coming from those. That leaves 420,000 mortgages issued in the last 10 years that would be responsible for 7000 of the defaults, a rate of 1.7%. The default rate separated out for this pool is put in pink on the graph. As an aside, it goes off-scale in 2009 — in part because the fixed 0.25% default rate assumption simply wasn’t true for the regular mortgage pool (times weren’t great), and in part because that’s when house prices stopped going up and actually went down (briefly).

Now, this is all back-of-the-envelope and full of room for error. This is not the one peg I’d hang my housing bear hat on (that would be price-to-rent). But it is another way of looking at things that I hadn’t come across before.