CPP Calculator with CPP Enhancements

December 16th, 2016 by Potato

“How much CPP will I get?” is a common question, and an important one that will help feed your financial planning. You can get a statement detailing your CPP contributions from Service Canada, but unless you’re close to retirement this isn’t super-helpful for planning purposes because it’s harder to do what-ifs with it. Indeed, it will basically assume that you’ll continue earning at your current rate until a given age, which is not helpful if you’re trying to evaluate early retirement scenarios. Plus, it’s a fair bit of work for precision when you may just want a good enough estimate. There’s also a calculator at Service Canada that includes the CPP, but it’s web-based so not great for playing around with, and it doesn’t do a good job of incorporating changes to future income, nor does it appear to be updated for the changes to CPP (announced in 2016, and partially implemented now).

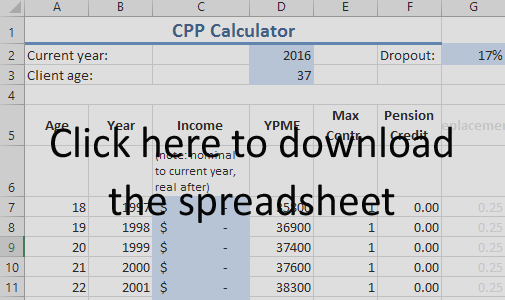
So I’ve built a spreadsheet to let you do just that. Click here to download it (Excel) (updated for 2022’s YMPE) (or here for OpenOffice). Keep reading for details on the calculations and how to use it.

A screenshot of the CPP calculator spreadsheet

Background and Acknowledgements

This came about because Sandi Martin came to me asking how to solve the problem of estimating the future CPP for people that would partially benefit from the changes to CPP announced in 2016 (which will be slowly implemented over the coming years). She had a spreadsheet for the old calculation, but I pretty much started from scratch to build this in. Having her sheet in front of me as I did so was helpful, and she was instrumental in the testing and trouble-shooting.

This post by Doug Runchey was hugely helpful on the algorithm CPP uses, which is not as intuitive as you would think. Doug offers a service to calculate your CPP precisely, so if you need to know down to the last dollar how much you’re going to get, contact Doug and pay him to run that calculation for you. Update: Doug and David Field have combined to create a web-based calculator here. If you can upload a statement of contributions, that will be more convenient. If you want to play what-if games or have to enter your data manually, then my excel version will be more convenient (in part because of the fill down function of excel, and also because mine won’t give you errors if you enter an amount above the YMPE).

Instructions

Simply fill out the boxes shaded blue, then scroll down to see how much your CPP is. The year and age should be self-explanatory.

Dropout: You’re allowed to drop a certain number of years from your CPP calculation. This lets you have a few years of low/no earnings and still collect the maximum CPP. Right now you’re allowed to drop 17% of your working life (over at CPP it’s actually in months but the spreadsheet uses years). So the number of years that works out to depends on when you collect CPP. However, there are cases where you can use the child-rearing provision to drop more years — use this field to add those drop-out years, in percentage form. Note that if you’re adding years as a percentage, now you’re making an assumption on when you’ll take CPP, so the table at the bottom will have further approximations for you.

Income: Enter how much you earned each year towards CPP. For years before 2019 enter the actual amount in that year’s dollars. For years after 2019, use real dollars. That is, if you’re earning $50,000/yr now (just a bit under the YMPE), and next year expect to get a cost-of-living raise only, enter $50,000 for 2018 — you’ll still be at the same fraction of that year’s CPP maximum. If you’re expecting a 4% raise — 2% cost-of-living, and 2% real increase in pay, then enter that increased amount above inflation for the future year ($51,000 in this example). And that continues for future years: if 10 years from now you expect to just pace inflation, keep filling in the same salary figure in 2019 dollars.

Otherwise, have fun exploring your what-if scenarios for when you stop working, etc.

Results

Keep scrolling down past all the years to enter your income history, and you’ll find a little table with the results — how much you can expect to earn from CPP annually. This includes the bonus/penalty for waiting to take it/taking it early, so you can quickly see about how much you’ll get for taking it at different points.

Approximations

The calculation should give you your CPP benefit to the nearest 5% or so (several people have sent me their statements of CPP and even for those collecting under the old system, there are differences of ~1-3%). I’m happy with that level of good enough — after all, you can get about that much difference just from deciding whether to enter your age as of the beginning of the year or the end of the year. If you need more precision, lookup Doug Runchey’s service.

CPP is actually based on months of contributions (and months of drop-outs, etc.). Here I’ve just rounded off (discretized) to years, which is going to cause a bit of discrepancy. This will also cause a slight issue in the table of results for taking CPP at different ages, as whole years of drop-out pop up at 62 and 67 (vs. the more gradual inclusion of drop-outs when you discretize to months).

You can drop extra years for the child-rearing provision, however there are some extra rules about the dropping out that the spreadsheet doesn’t account for. If you add extra percentage drop-out for child-rearing, that’s not necessarily going to translate into the same years dropped out at each age for taking CPP, so it will be less accurate if you’re including extra drop-out years for disability or child-rearing. On top of that, there has been concern that the drop-out provisions wouldn’t apply to the enhancements, though with several years to the enhancement roll-out this may yet get patched. To assume the CBC article is how it will be (i.e., it won’t get patched), reduce your drop-out by ~33% for years after the full implementation.

The five-year average rule for determining the pension payout is hard to apply in the future where the inflation rate is unknown, so I’ve assumed an inflation rate similar to that of the last 5 years.

Why Doesn’t This Match My Service Canada Estimate?

There are a few places where the government has put up CPP estimators. If you ask Service Canada for your CPP estimate, in the very fine print you’ll see a note about the assumptions used, including that they estimate that you will continue to contribute at the same portion of YMPE until age 65 that you averaged until the date of the statement. So if you had a few years off or lower-paying jobs in your younger days, you might only be averaging 0.9 or 0.8 of the YMPE, and even though you’re earning well over that now (and punched into the spreadsheet that you’d keep going at it to 65 at that rate), the government’s statement assumes a lower continued contribution. Similarly, some people assume that because they didn’t provide any info, the pension figure applies even with no further contributions, yet entering 0 for future years in the spreadsheet results in a lower estimate. The Retirement Income Calculator they put up likewise has issues, not including the enhancements to CPP announced in 2016, as well as other issues.

Commentary

I was actually somewhat shocked as I went through this at how mis-leading the initial government release on the CPP enhancement was. I had seen the “upper earnings limit will be targeted at $82,700” in all the news stories — which sounds substantially higher than today’s ~$55k figure. What I didn’t see was that this figure was not in today’s dollars, but in 2025 dollars, and that they assumed a rate of inflation close to 3% (well above the recent experience) — in today’s dollars, the new upper limit is actually just $62,586 (14% higher).

I was also surprised at some of the little things in the calculation, like that the payout is based not on the YMPE level when you start collecting, but a lower number (the average of the previous 5 years). I can’t fathom the point of this step of the calculation.

Otherwise, I haven’t seen explicit information on precisely how the CPP enhancements will be rolled out, but have made reasonable guesses as to how they will be pro-rated. What are the CPP enhancements, you ask? In short, an increase to the maximum amount you can contribute to CPP (so it will cover more of your income if you earn more than the maximum now), and an increase to the amount of income CPP will look to replace (from ~25% now to ~33% for those in the future). These were announced in the summer of 2016, and will start being phased-in in 2019 over the course of 7 years.

Updates

Version 2: Adjusted the age 66-70 calculations to keep using 48 years as the number of contributory years as part of the over-65 drop-out provision (see comments). Also rolled forward the calculations for 2017’s YMPE.

Version 3: Rolled forward to 2018’s YMPE. Also added the year’s basic exemption (YBE), which has been $3500 for a while (my entire working life) — if you earn less than that, the sheet will now zero out your pension credit. While the exact CPP calculation is hard to dig up, every source I find indicates that yes, if you earn over the YBE you still get credit for the full amount of your earnings even though you only pay on the portion over that. That is, if you earned $4000 last year, you only paid CPP contributions on $500 of that, but the full $4000 is used to figure your pension credit (e.g., the example in this post by Doug Runchey, where someone pays $0.05 to get a pension benefit of $21/yr when just over the YBE).

Version 4: No major changes, just rolled forward to 2019’s YMPE.

Version 4a: Thanks to Craig B who pointed out a (likely) error in the number of contribution years — it looks like I was including the year of retirement itself, rather than the natural assumption that if you’re taking CPP at age 65 that you do so essentially on your birthday, not after another year of working at 65. It would be a fairly small error for most cases (within that ~2-5% anyway), but good catch! I say (likely) error above because it’s late and my brain is fuzzy after just submitting a grant, and I haven’t had time to check the revised version against the various real test cases I had for verification, but I’m pretty sure this was a minor error and have put up version 4a. I will adjust this message and roll the version number up to 5 after I have a chance to think and test further (and there is a small chance I just introduced a minor error instead — but again, only another ~2% off). You can download version 4 here (or the link above for v4’s notes) if you want to check both ways.

Version 5: No major changes, just rolled forward to 2021’s YMPE. Note that 2020 was a garbage fire of a year, so there was no version between 4a (up to 2019’s YMPE) and 5 (2021’s YMPE).

Open Office Calc version of V5: trying to bring the Excel version into Open Office broke all of the INDIRECT() cell references at the bottom. I’ve fixed that in this version, and everything appears to be working the same as in excel version 5.

Version 6: No major changes, just rolled forward to 2022’s YMPE. And here is the open office version of the same.

Once again, click here to download the CPP calculator (Excel). (or here for OpenOffice).
Emergency Funds FTW

December 1st, 2016 by Potato

I don’t want to risk having my personal finance blogger license revoked, but I haven’t been paying attention to our budget as we deal with Wayfare’s recovery. I’m pretty sure we’re spending a bit more than average — we’re certainly eating more pre-made food, and spending more on drugs and parking and a walker, but much of that pre-made food is brought over by family and friends.

I actually haven’t been thinking or worrying much about money the past few weeks, which is as it should be. Early on my mind would wander to the topic and I’d try to crunch numbers as I rode the subway, without the benefit of a proper spreadsheet. But at some point I internalized the message that we’ve got an emergency fund and we’ll be ok. So I stopped worrying and focused my energies elsewhere.

And really, that’s what emergency funds are for, so you can make it through these completely random, crazy events without also having to worry about money in the short term.

TTP is a very rare disease, with an incidence of about 3 in a million. But that means that next year about 100 families in Canada will be hit by this. Another 200,000 or so will face a cancer diagnosis. Some others will be hit by a job loss, or a major repair bill.

As financial literacy month draws to a close I just wanted to quickly underscore how important it was to be savers when times were good, so that we could make it through a trying time like this. Yet many Canadians don’t have an emergency fund (here’s one survey that says a quarter have less than $1000). I mostly focus on investing stuff — it’s important too, and where I can actually make a difference — but emergencies can strike at any time. I don’t know what to say to all those people to get them to start, but having an emergency fund is important. I don’t know how we’d be handling this situation without it.

Robo-Advisor Comparison Calculator

November 23rd, 2016 by Potato

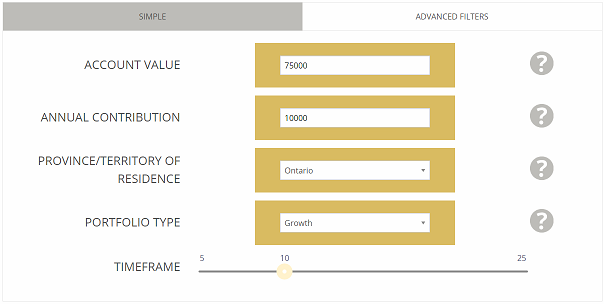
I’m very happy to finally be able to announce something I’ve been working on for months: a new Robo-Advisor Comparison Calculator at autoinvest.ca!!

I think the robo-advisor model looks like a great choice for a lot of Canadians. Many will save even more money with a do-it-yourself approach (and I have a book and course to help show them how to do that). But for those who don’t have the interest in DIY (or who will DIY all the parts that involve decisions, and use as service for the purchasing and rebalancing parts), having a low-cost option to handle your investments is wonderful.

Why a Calculator is Needed

Of course, there are a lot of robo-advisors out there these days, and trying to find the one that’s best for you can be a challenge. There certainly isn’t a clear winner across the board, and even comparing them at a glance with a table is quite the challenge. For starters, there are several pricing models in play. I love the flat-fee model that firms like NestWealth use, but for many people with smaller accounts paying a percentage of assets is still the cheaper way to go. However, even there each firm has their own rate and their own thresholds for where their percentages change — and some are marginal (like 0.5% on the first $X no matter how much you have) and some are thresholds (X% on the whole amount as soon as you cross a threshold).

On top of that, each firm has a different set of investments that they will put you in to, with their own underlying costs. Even finding what these costs are can be a challenge sometimes, and they’re going to be different depending on your risk profile. Sometimes even by how much you have to invest, as you may get access to cheaper underlying ETFs when your account gets larger (or conversely, there may be more slicing-and-dicing for larger accounts).

So Sandi Martin made a nifty tool a while ago to help with this comparison. It was popular, but that popularity led to some issues: people were colliding when too many tried to use it at once, and every now and then people would use cut & paste (instead of copy & paste) which broke the cell references. It was time for something better.

A Better Calculator

She had the idea of building a better, dedicated calculator on its own website, and I jumped on board to partner with her on making it happen. While we were at it we added some nifty new features, including the ability to filter the results according to whether they offered certain services, account types (like the RESP, or RESP with BC/Sask provincial grants), or investing styles.

A part I really like is how she broke down planning services – lots of them have planning or concierge or other advisory services, where you can speak with a person in some capacity about your particular situation. But whether the advice is limited to your portfolio, or savings, or your more general financial situation can vary. So Sandi has broken the advice up into several categories with representative questions.

It’s fast, doesn’t have the issues of the spreadsheet, and looks cool. I’m super proud of this.

Things to Remember as You Use It

This will help you compare the costs of different robo-advisor services for your situation. However, the cheapest one may not necessarily be the best one for you. Having the pricing information helps you better compare the other features, so you can see if you’re willing to pay $X more to get certain kinds of advice, portfolio options, or whatever feature it is that interests you.

We haven’t put in a DIY with ETFs option to compare to the robo-advisors. There are some good reasons for that: because it would always be cheaper, because I have DIY stuff to sell and we don’t want the perception of a conflict-of-interest, and because we don’t want people who may be looking for a robo-advisor because they’re uncomfortable with DIY to feel pressured to go down that road. But if you’re DIY inclined, then approx. 0.14% + some trading commissions (depending on your broker, but ~$10-100/yr is not far outside the ballpark, depending on how you arrange your investing) would be a decent comparison figure.

A preview of the calculator at autoinvest.ca

People Who May Like This

The obvious target audience is people who want to go with a robo-advisor and need a starting point for their comparison, and those who are stuck choosing between a few competitors and want a way to calculate the cost difference involved.

I think that other groups who may be interested in this include mortgage brokers and fee-only planners. The latter is fairly obvious: they can provide the planning but not the asset management services, so they can pull up the calculator and point their clients to a robo-advisor that suits their situation if needed, with no concern about a direct referral creating the perception of a conflict-of-interest.

For mortgage brokers, the notion of investing doesn’t come up often. However, a big challenge is helping their clients move away from the gravitational well of the big banks. If they can help their clients find a better home for their investments, that makes them less resistant to going with a non-bank lender for their mortgage, while potentially also saving the clients a bunch on their MERs.

Behind-the-Scenes

How did you make it?

The data-gathering was perhaps the hardest part, as a lot of the information that goes into the calculator is not readily available. Sandi had to hustle to get all the information out of all the firms, and then verify its accuracy.

The tool itself is not a spreadsheet any more, it’s a custom bit of programming using PHP, SQL and some Google APIs. We did have to outsource some of the programming, which cost actual money.

Any amusing stories to share?

Actually, not really, though there is a bit of minor frustration involved.

Part of my job was to help come up with the math and logic for the developer to then implement. So I had a fairly general structure that would accommodate several fee tiers and pricing models: flat fees, marginal fees, threshold percentages, and even mixed models (as one firm did until recently). We could also account for different fees on the underlying portfolio, which can change based on the amount invested. We got it all set up at the same time that data collection was going on, and had to decide on how many tiers to build in. “Four or five should do it, who would possibly have more than that” I said.

Well, you’ll see a slightly awkward work-around with one firm that did have more tiers in their pricing structure than we built the back-end database to handle (and I’ll note the end result is still correct).

How do I get my ad on this?

Please contact Sandi at sandi[at]autoinvest.ca.

Insurance Woes

November 17th, 2016 by Potato

This post was drafted a while ago, when Wayfare was trying to get insurance in the spring. I was sitting on it partly because I was waiting for her to try another avenue (or just again with another year of stable post-mat-leave income) to get disability insurance and have a happier outcome. With recent events, it seems like just an extra kick in the pants.

“Insure all the things!” Wayfare was exclaiming after her two-hour meeting with the insurance saleslady. Considering she had gone in on a surgical strike mission to acquire some disability insurance, and came back loaded with pamphlets on all manner of insurance products yet lacking a quote on disability insurance, I have to commend the saleslady’s skill.

I have a very stoic view of insurance: if there’s a chance that some event will ruin us, we need to try to insure against it (and take reasonable precautions to prevent it from happening in the first place — note that in reconciling my philosophy and my actions, diet and exercise are not classified as reasonable precautions). Insurance is not something to buy to get a windfall in case of tragedy, and so we aim to self-insure wherever we can.

It’s also important to understand that we are in no way normal parents of a young child. Financially speaking, losing one parent or the other will not ruin us. We both have advanced degrees, we both work, and we have financial resources sufficient to cover over a year of cash burn if we had to take a prolonged leave of absence — plus as renters, we have the flexibility to reduce that cash burn with just a few months’ notice1. We are, as Miss Sunlife put it, “like a family of happy little squirrels, burying [our] nuts all over the yard in anticipation of winter.”

So my main fear is prolonged disability — because living our current extravagant lifestyle of having grass on both sides of our house (a detached house!) in Toronto requires two incomes, and one of us becoming disabled doesn’t free up the other to move on and move out in the tidy (if morbid) way that death would. Thus, disability was the one kind of insurance I did want to pay for, and we finally got off our butts to get a quote and make that happen.

But Wayfare came back full of weepy scenarios that appealed to emotion. What if something happened to little Blueberry? What would we do? Wouldn’t we want to be able to take some time off work to care for her or grieve? Yes — but doing so would not ruin us. We would survive and so we don’t need to insure against such a low-probability event. And if she died, I would not expect to long survive her.

“What if she got some childhood illness and then couldn’t get insurance of her own when she was an adult? If we get insurance on her now, then she can be automatically insured when she’s older and won’t have to go through this process.” Insuring the ability to get insurance is taking things too far for me. That’s second-order insurance. The fact that Miss Sunlife was able to make this argument stick firmly enough in Wayfare’s head for her to try to enthusiastically convince me of the need to insure our daughter demonstrates her level 8 insurance warlock sales skills. There were also pitches for critical illness insurance (which, reading the materials in hindsight, would not have covered this particular critical illness) and life insurance for us.

This crazy process started from a trip to the insurance saleslady looking for disability insurance for Wayfare, a self-employed person. She did not come back from that initial 2-hour meeting with a quote for disability to consider, so I told her to give up on Miss Sunlife and go talk to one of the nice people who stop by the blog who’re tuned in to the insurance world to figure things out and get a quote (or tell us what route we should really be taking to get one). But she’d already started with Miss Sunlife, and Miss Sunlife was nice, so she persevered. It took several more visits and lots of documentation archaeology (including lots of making Wayfare wait on hold to try to get the right documentation out of her doctors’ offices) to finally get a quote to decide on, and even then it was a quote, not a matrix of choices — each refinement to what we might want would require another visit. After many visits in person (because this can’t be done over the phone or online, obviously), we chose the options we wanted and needed, and put it through to the underwriters. Finally, Wayfare heard back: her application was denied. So she wasted hours of time and a few subway tokens, and the rejection letter doesn’t even give a reason (because her self-employment income history is variable with a recent mat leave, so she should try again in a year or two after that falls off? Because of pre-existing health issues and she shouldn’t waste her time again? Because something at the insurer got accidentally shredded and they didn’t want to ask for it again?).

It was a disappointing result, and a discouraging process: even if we were successful in getting insurance, it’s hard to believe that people who may not be fully sold on the need for disability insurance would put themselves through that massive time-sink. I didn’t even go through it myself (I am part of a group plan at work), but watching how much time it took, it will be hard for me to push freelancers I meet who really are under-insured to go take care of it.

1. This is because we live in way more space than is needed by a single-parent family — a 3-bedroom house with two freelancer office spaces. A (tragically) single-parent subset of our family could readily down-size to a 2-bdrm apartment. We also live in a massively expensive city in part to solve the two-body problem. One of us being out of the picture would free the other to move anywhere else, with a lower cost of living.

Trump and Investing

November 7th, 2016 by Potato

Someone taking the course asked this question, and I’ve seen it in multiple other forums lately: how would a Trump win in the election affect my investments? (Or similar ones like should I sell or should I delay investing until after the election?)

This is the sort of question that is very natural to ask, especially if you read the news or watch TV — the business entertainment channels are full of talking heads discussing these sorts of events and what effect they may have on markets. But remember, there is always a Trump (or Brexit, or sequestration, or imminent recession, or rate hike, etc., etc.).

It’s very easy to see some cause of uncertainty and doubt and let that translate into fear of investing (or staying invested). But there are some much better questions to ask yourself before selling in fear over a certain event:

  • Do I believe the evidence that short term events are extremely difficult and/or impossible to successfully trade?
  • Is the risk already “priced in”?
  • What happens if I’m wrong? For the 2016 US election example, the S&P500 is down about 3.5% on the month as I write this. How big of an effect would a Trump win be? What’s the likelihood of that? It may be partly priced in already – and then if Clinton wins, the market may snap back up. It may even snap up if Trump wins.
  • What happens if I’m right?
  • Do I want to open that door? This is perhaps the most important question of them all. Trading on short-term fears is a behavioural finance mistake – you have a long-term plan that involves expecting events like this and riding through them. Even if this time you have correctly read the situation and have insight others in the market lack and you are positioned to make money (or avoid a loss) from your brilliance, do you want to open the door to this kind of activity?

Remember, most of the time most people get these kinds of moves wrong and will end up doing worse than if they had just held on. And getting one move right and making money at it can paradoxically be bad for your long-term plan, because it’s very hard to believe after that fact that you were either just lucky, or that this was that one time when your intuition/analysis was superior to everyone else’s. So the next time some short-term event comes along, you’ll be more likely to make a hypothesis and react, rather than sticking to your long-term plan. Even if you lose more money on the next three events than you saved on the first short-term trade, if you’re like most humans you’ll still be tempted to act on your feelings for the fourth event, because that first success convinced you that this was a smart thing to do.

This philosophy and investing approach means that there will be a time when you “just knew” that some terrible thing was going to happen before it did. You may kick yourself for not acting… but try to remember all that other things you “just knew” were going to happen but didn’t. So maybe you will lose some money next week because of fear surrounding the election (or maybe not – who knows!). But by sticking to your long-term plan anyway you’ll also save yourself from that time when the talking heads said you had to stay in cash after selling out in 2008 until the March 2009 bottom was “re-tested” or that other time when the bad jobs report surely signalled the start of a new recession.